|

|
Linear Inequalities (single variable)
|
| This first example will show you how to enter the inequality and how you can enter both sides of the inequality as a way to check the exact location where the inequality begins. |
|
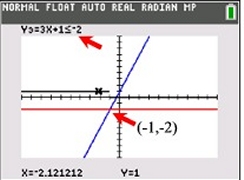
Example 1: Solve the inequality: 
-
Enter each side of the inequality into
Y1
and Y2
-
Enter the inequality statement into
Y3 : 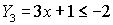
(The inequality symbols are under the TEST Menu - 2nd MATH.)
This step could also be entered as Y1 < Y2.
-
Graph. Y3 is horizontal. Use
can use the intersect option, (2nd Trace #5
Intersect) on Y1and Y2 to find the "exact" point where the inequality
answer begins (which is (-1,-2) and moves left).
-
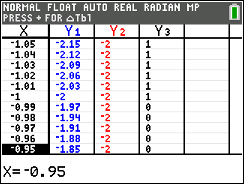
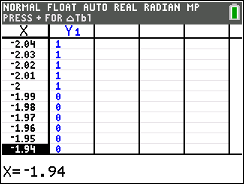
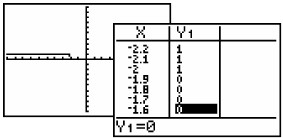
Do a Boolean Check: Where the
inequality is "true", the y-values on the graph will be a 1.
-
If you look at the table, 0's will be listed
where the inequality is false and 1's will be listed where the
inequality is true. (arrow to the right to see
additional tables)
-
Answer: x
< -1
Remember that the calculator cannot draw an open
or closed circle on the intervals. You will have to determine
which circle is needed based upon whether the inequality
includes "equal to".
If you turn off the axes (FORMAT
- 2nd ZOOM), you will be able to see the graphing of
the 0's and 1's more clearly.
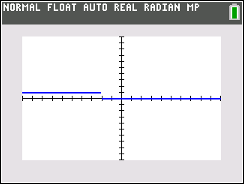
| On older model calculators, notice that the small vertical
segment connecting the 0's to the 1's is simply the
calculator being set in "connected" mode.
Change to "dot" mode if you want to eliminate this tiny segment. |
 |
|
|
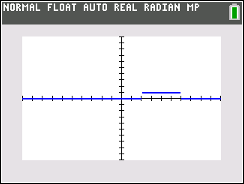
Graph
Trace, move UP to Y3,
the black spider appears
on the horizontal line.
You can see the break
from Y3 = 1
to Y3 = 0.
|
| Example 2 will show you how the calculator automatically deals with the direction of the inequality. |
|
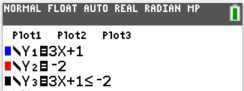
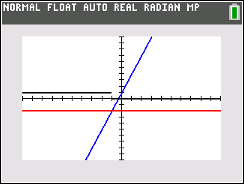
Example 2:
Solve the inequality: 
- Enter the inequality into Y1
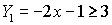
- Graph
- If you enter the inequality directly into Y1, you will see only the Boolean graph.
It may be necessary to look carefully in your
table to find the exact point where the inequality answer
begins.
- Such answers can be found easily if the answers are integer
values. Otherwise, you will want to use the intersect
option mentioned in Example 1 to find an "exact" starting point of the inequality.
- Answer:
x < -2
In this problem, the calculator automatically took care
of reversing the direction of the inequality when solving.
The older model graph is shown, with the tiny segment connecting y = 1 to y = 0,
|
 |
| Example 3 will show you how to deal with a compound inequality, where you must deal with two inequalities at the same time. |
|
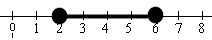
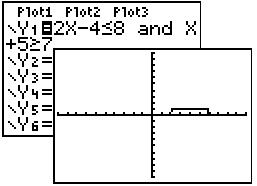
Example 3: Graph the solution set for 2x - 4 < 8 and x + 5 > 7
|
Algebraic solution:
Solve each equation separately. The answer
will be points
that make BOTH sets true.


Answer: 2 < x < 6
 |
|
Graphical solution:
Both
inequalities are entered into Y1
with the use of "and".
Find "and" by
using the CATALOG (2nd
0) or
TEST (2nd MATH)→ LOGIC, #1 and.
Older model.
|
|
|

Finding
Your Way Around TABLE of CONTENTS
|